View P3 Validations
After you create a policy and PhotonIQ Performance Proxy (P3) gets a request for an optimized page, P3 validates the page by running visual and functional tests. You can view these validations in the PhotonIQ Performance Proxy dashboard.
View Validations
Perform the following steps to view P3 validations:
- Log in to your PhotonIQ Performance Proxy dashboard.
- Click Validations.
- From the Device Type list, select the device type you want to view validations for:
- Desktop - This is the default selection.
- Tablet
- Mobile
- (Optional) From the Device Resolution list, select a resolution to view validations for. Options are different for each device type.
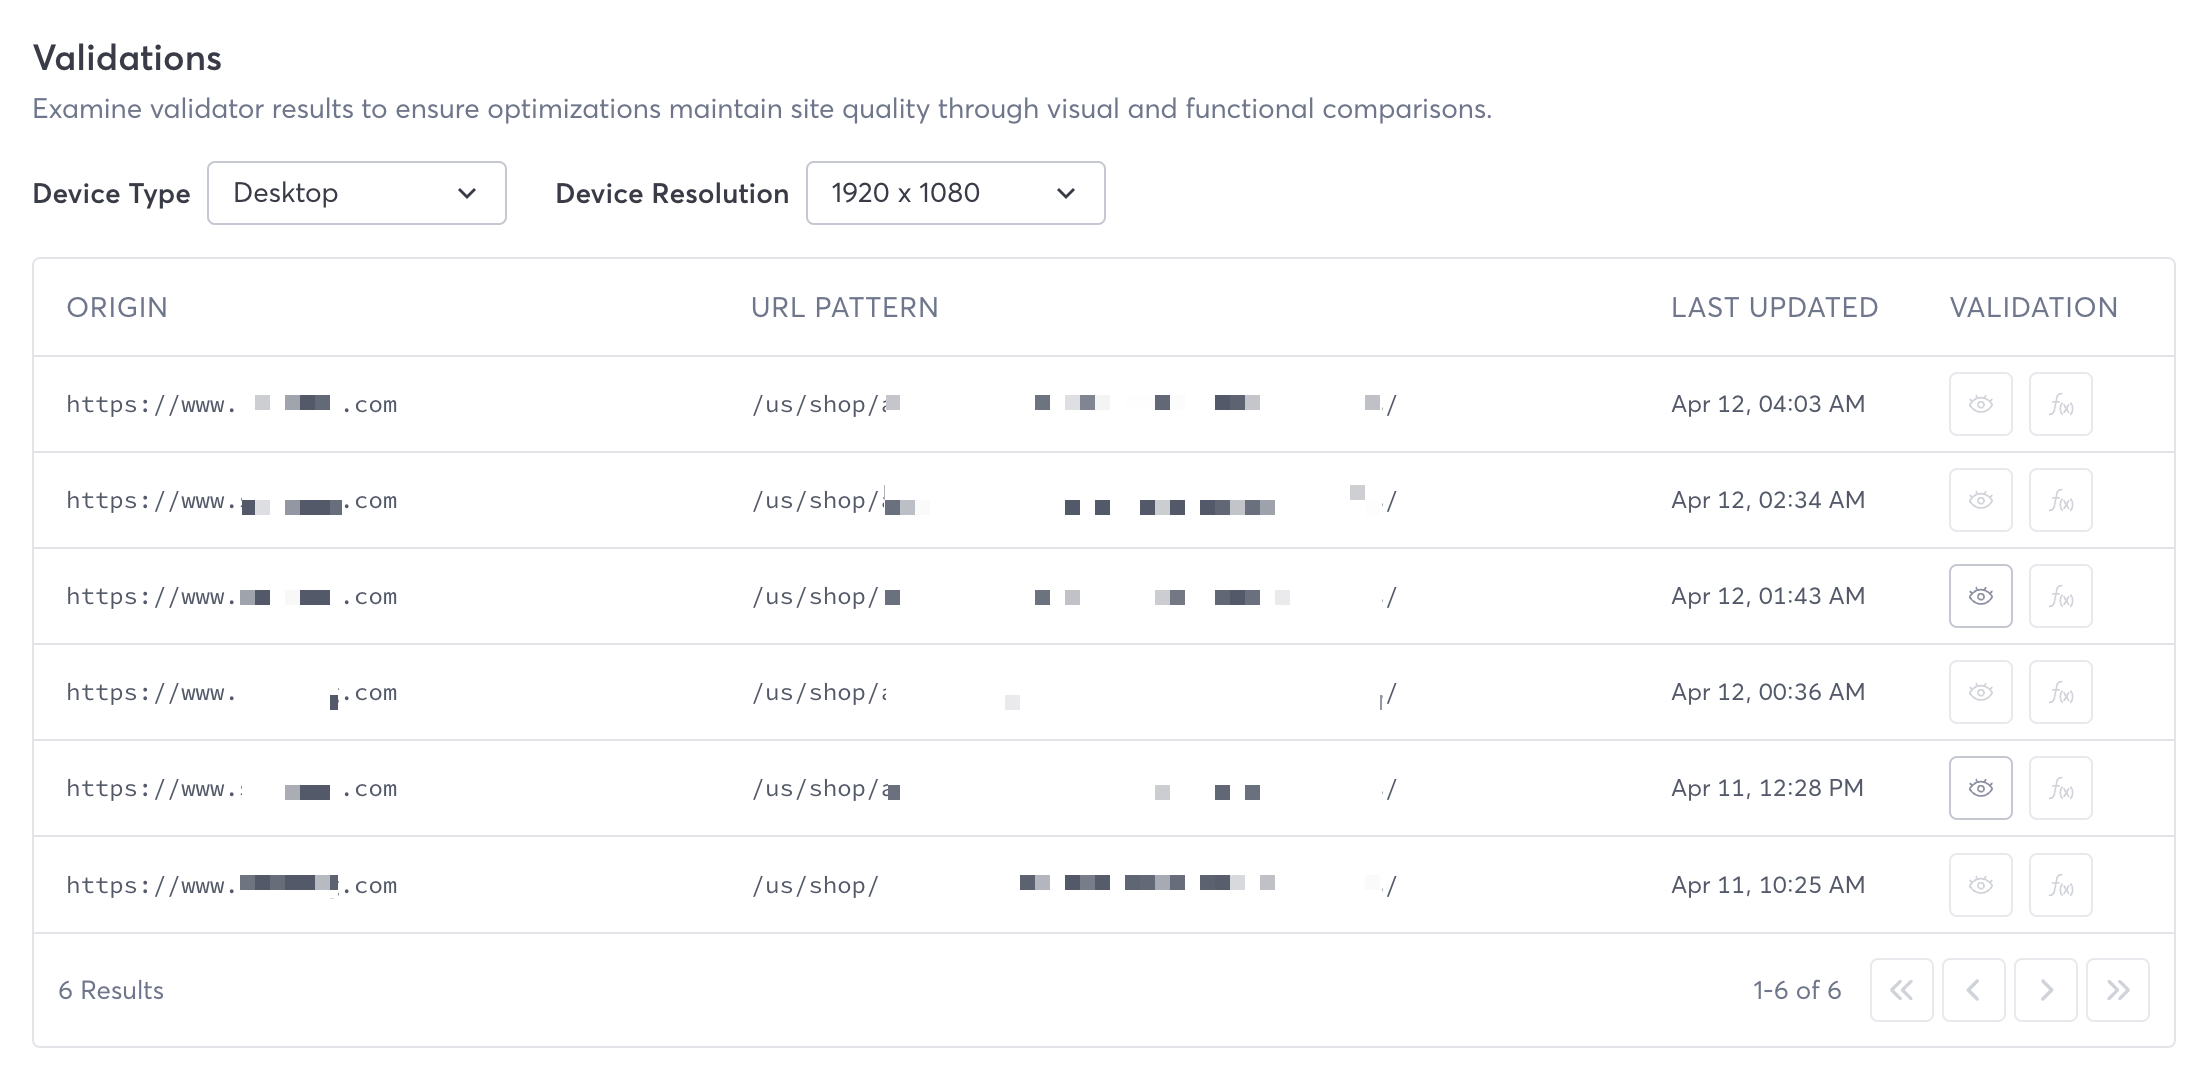
Validations Table Fields
The Validations table provides the following fields:
- Origin - The base URL that was validated.
- URL Pattern - The specific URL that was validated.
- Last Updated - When the optimization was last updated.
- Validation - Types of validation: Visual and Functional. Click one to view validation results.
Visual Validation
Visual validation validates how closely the optimized page matches the appearance of the original, unoptimized page.
After you click Visual, the dashboard displays a Visual Comparison page with a number of fields and a side-by-side visual comparison of the original and optimized versions.
Analysis
The following fields are displayed:
Total Pixels - The total number of pixels analyzed in the visual comparison between the optimized and original versions of the page.
Pixels Matched - The number of pixels that were found to be identical in both the optimized and original versions of the page during the visual comparison.
Pixels Mismatched - The count of pixels that did not match between the optimized and original page versions in the visual comparison.
Layout Analysis - An assessment of changes in the page layout by analyzing spatial arrangement differences between the optimized and original versions.
Color Histogram Comparison - An analysis comparing the distribution of colors (color histograms) between the optimized and original page versions to gauge visual similarity.
Structural Similarity Analysis - A measure that evaluates the similarity in structure between the optimized and original page versions, focusing on changes that affect perceived quality.
Edge Density Comparison - This compares the density of edges (transitions from one color to another) between the optimized and original page versions, indicating structural changes.
Pixel Intensity Distribution - This metric evaluates the similarity in the distribution of pixel intensities (lightness or darkness) between the optimized and original page versions.
Contour Similarity - A measure of how closely the contours (edges defining shapes) in the optimized page match those in the original page version.
Template Matching - Compares specific template patterns found in the original page to those in the optimized version to check for alterations.
Gradient Magnitude Similarity - A comparison of the gradient magnitudes (rate of change in brightness) between images of the optimized and original pages to evaluate detail preservation.
Fourier Transform Similarity - An analysis using Fourier transforms to compare the frequency components of the optimized and original page images, assessing patterns and textures.
Text Analysis - An analysis of the text content similarity between the optimized and original page versions, assessing changes in text placement, font, and legibility.
Hog Similarity - Compares Histograms of Oriented Gradients (HOG) between the optimized and original page images, useful for detecting changes in shape and texture.
Highlighted Missing Pixels and Optimized
The original and optimized versions are shown side by side. You can scroll down to see both pages. Any discrepancies, such as missing pixels, are highlighted in red on the original screenshot
Functional Validation
Functional validation measures how the optimized page functions compared to the original page. It views the network requests sent by the original, takes a random subset of those, and then checks to see if the optimized page is performing the same requests. It also, checks other aspects of web functionality, such as new errors and that elements such as links, buttons, and navigation are working as expected.
- Total Elements - Number of requests detected.
- Selected Elements - Number of requests selected to measure from the original, unoptimized page.
- Matched Elements - Number of requests matched by the optimized page.
If all is working well, then the number of selected elements and matched elements will be identical.