View P3 Metrics
After you have created one or more policies, you can track P3 metrics on the dashboard.
Access the Dashboard
- Log in to your PhotonIQ Performance Proxy dashboard.
- Click Dashboard.
- Select a time range to view metrics for:
- Last 24 Hours
- Last 7 Days
- Last 30 Days
Available Metrics
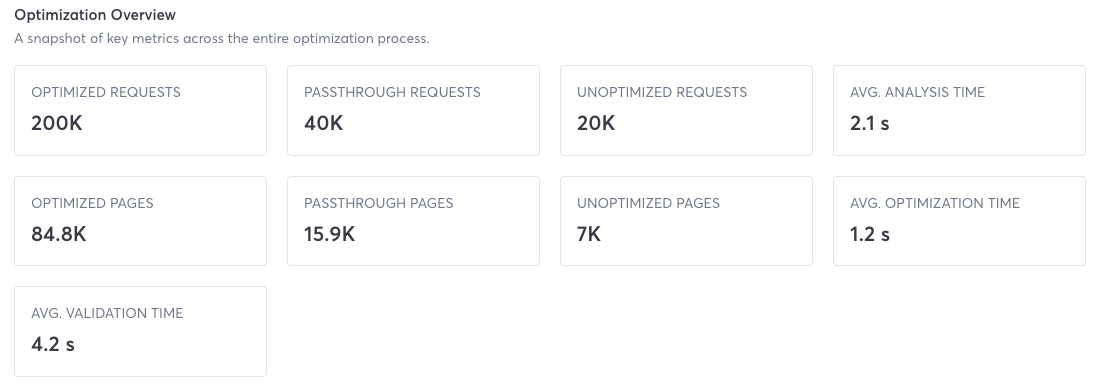
The dashboard displays the following metrics. For more information about these metrics, refer to P3 Metrics.
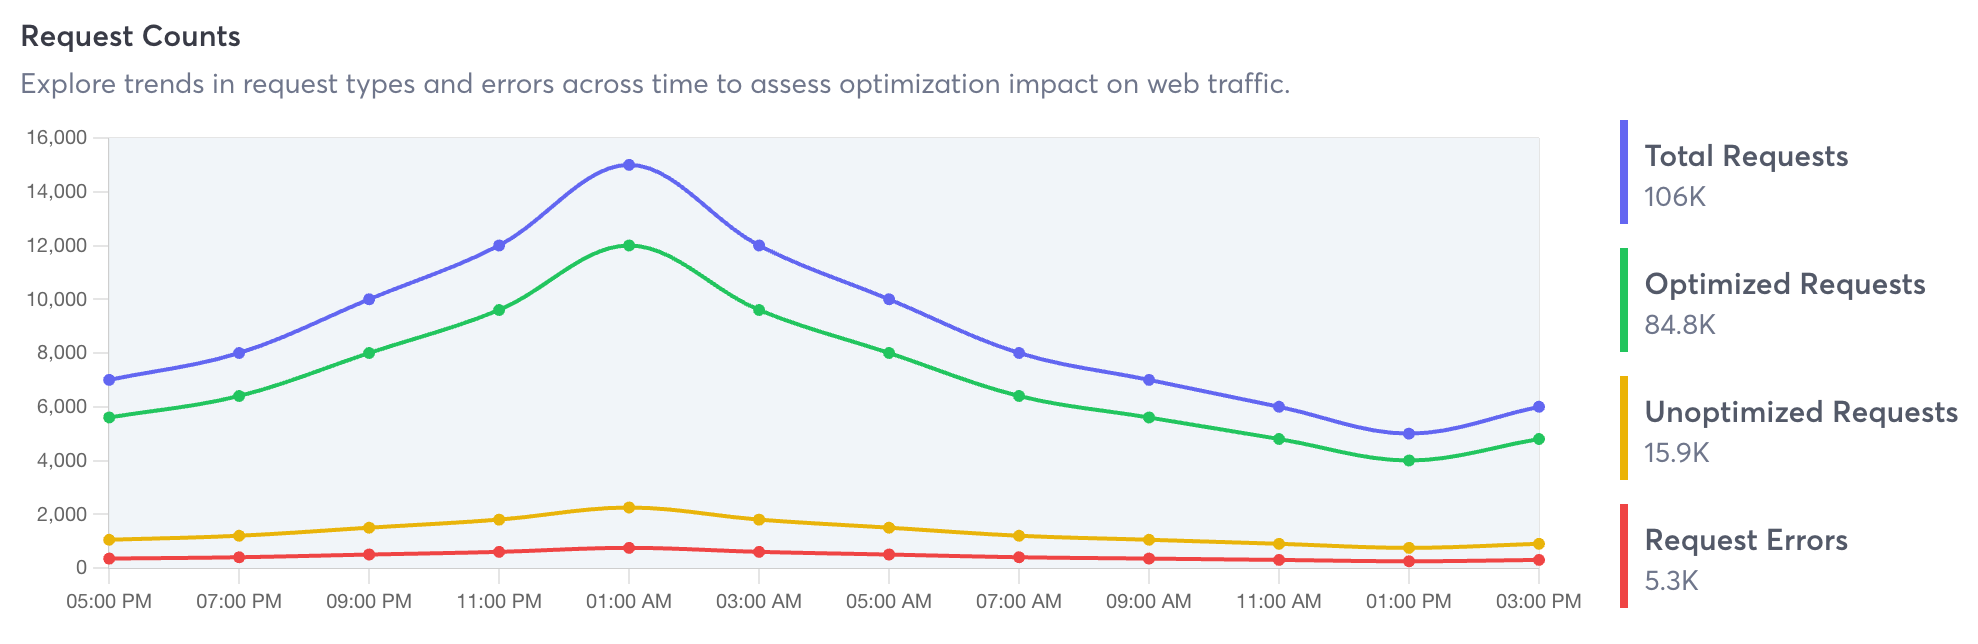
Request Counts
Hover your cursor over a dot for more information.
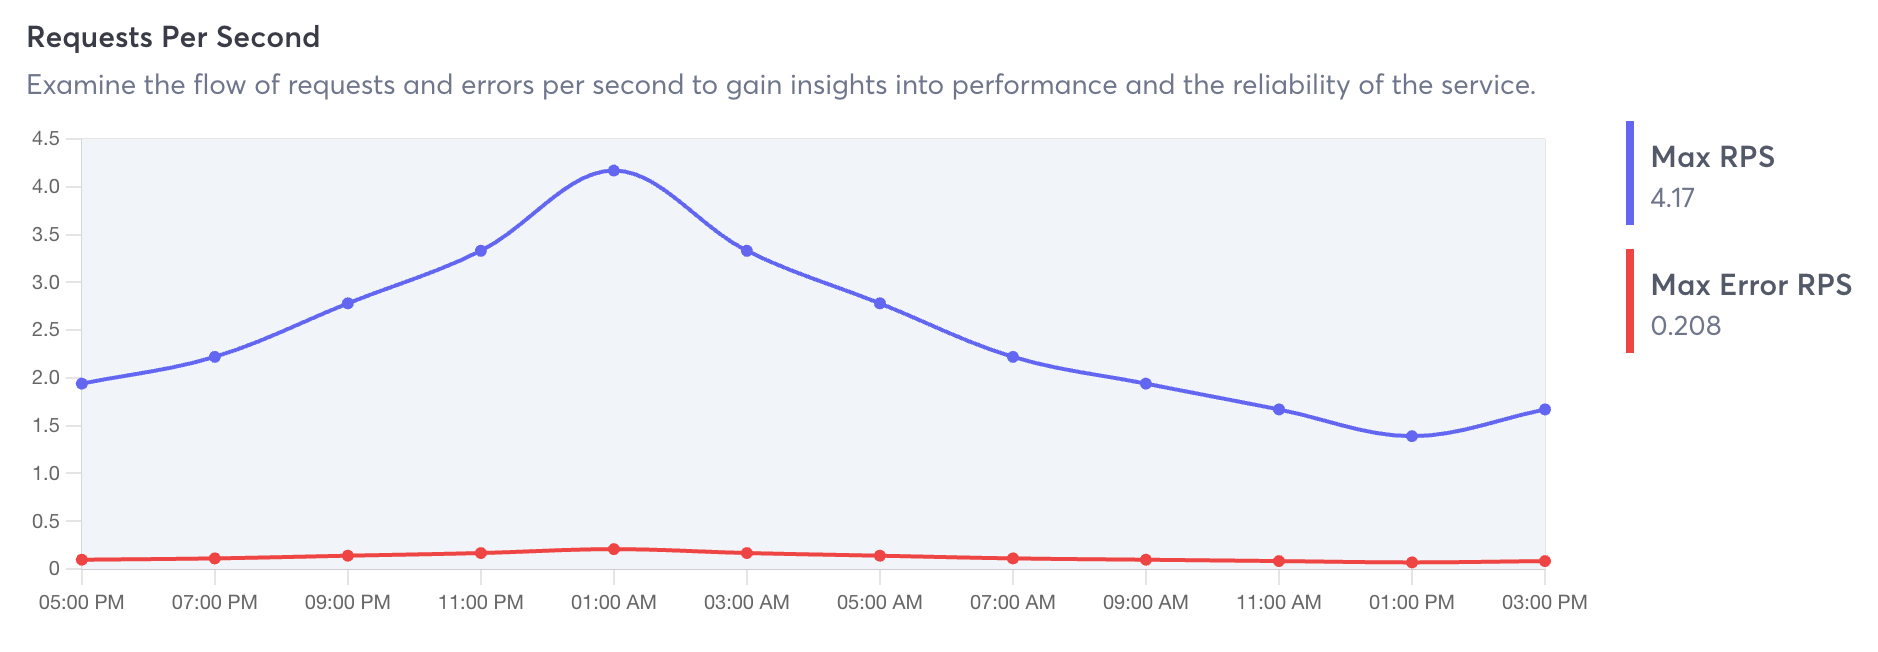
Requests Per Second
Hover your cursor over a dot for more information.
- Max RPS - Maximum requests per second.
- Max Error RPS - Maximum error requests per second.
Optimization Overview