View EST Activity
You have several options for viewing EST activity.
- Activity Settings tab - In the Activity tab in the web console, you can view EST activity.
- REST API - Macrometa provides API calls that allow you to view EST activity.
View Request Traffic
- Web Console
- REST API
Log in to your Edge Side Tagging dashboard.
Click Components.
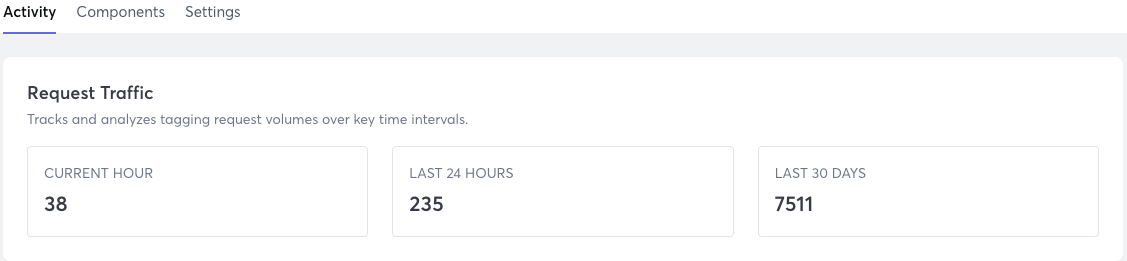
Scroll down to Request Traffic.
This section displays the total requests, including requests for metrics and page views, for the following time periods:
- Current Hour - The current hour, starting from
X:00. For example, if the current time is 4:23, then the total requests for the last 23 minutes are displayed. - Last 24 Hours - The previous full 24 hours. For example, if it is currently Thursday, then the total requests from Wednesday are displayed.
- Last 30 Days - The previous full 30 days. For example, if it is currently June, then the total requests from Wednesday are displayed.
- Current Hour - The current hour, starting from
Use our interactive API Reference with code generation in 18 programming languages to:
View Event Metrics
- Web Console
- REST API
Log in to your Edge Side Tagging dashboard.
Click Components.
Scroll down to Activity Summary and select a time period for which you want to view events:
- Current Hour - The current hour, starting from
X:00. For example, if the current time is 4:23, then metrics and logs for the last 23 minutes are displayed. - Last 24 Hours - The previous full 24 hours. For example, if it is currently Thursday, then metrics and logs from Wednesday are displayed.
- Last 30 Days - The previous full 30 days. For example, if it is currently June, then metrics and logs from Wednesday are displayed.
- Current Hour - The current hour, starting from
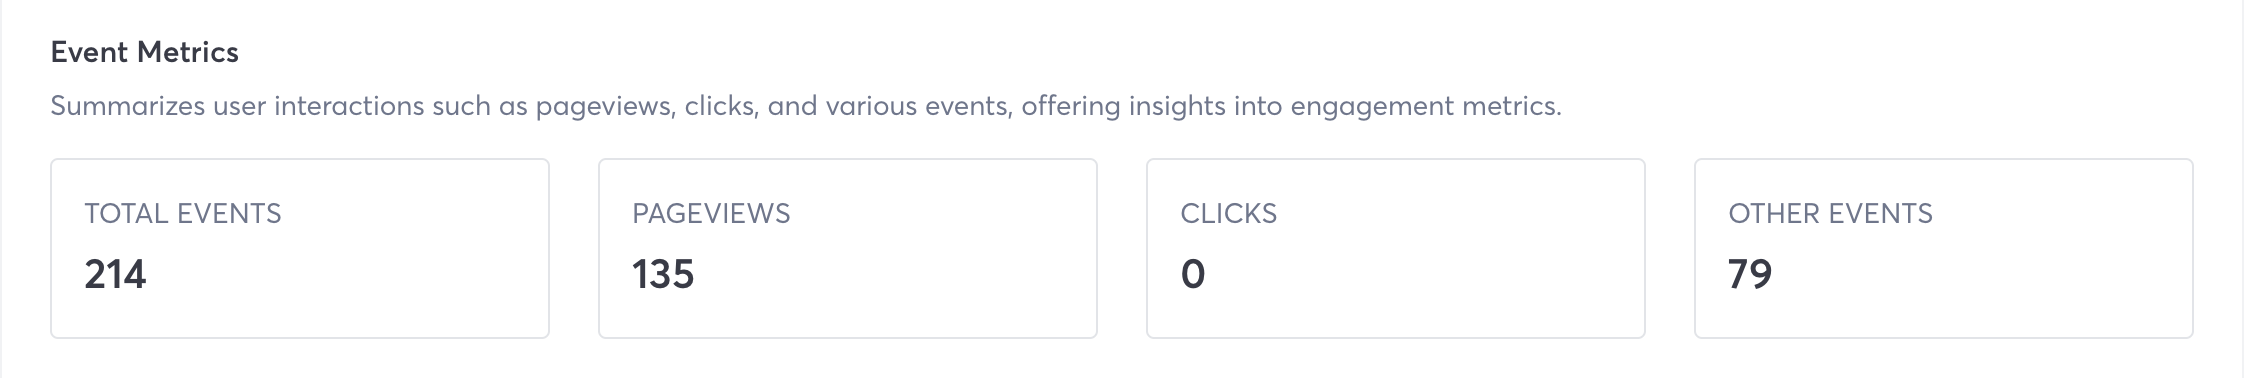
Scroll down to Event Metrics.
This section displays the total event count for third-party tag requests made during the selected time period.
- Total Events - Total number of events recorded on the tracked page.
- Pageviews - Number of times a user viewed a tracked page.
- Clicks - Number of times a user clicked on a tracked page page.
- Other Events - Count of events such as scrolls.
Use our interactive API Reference with code generation in 18 programming languages to:
System Update Log
- Web Console
- REST API
Log in to your Edge Side Tagging dashboard.
Click Components.
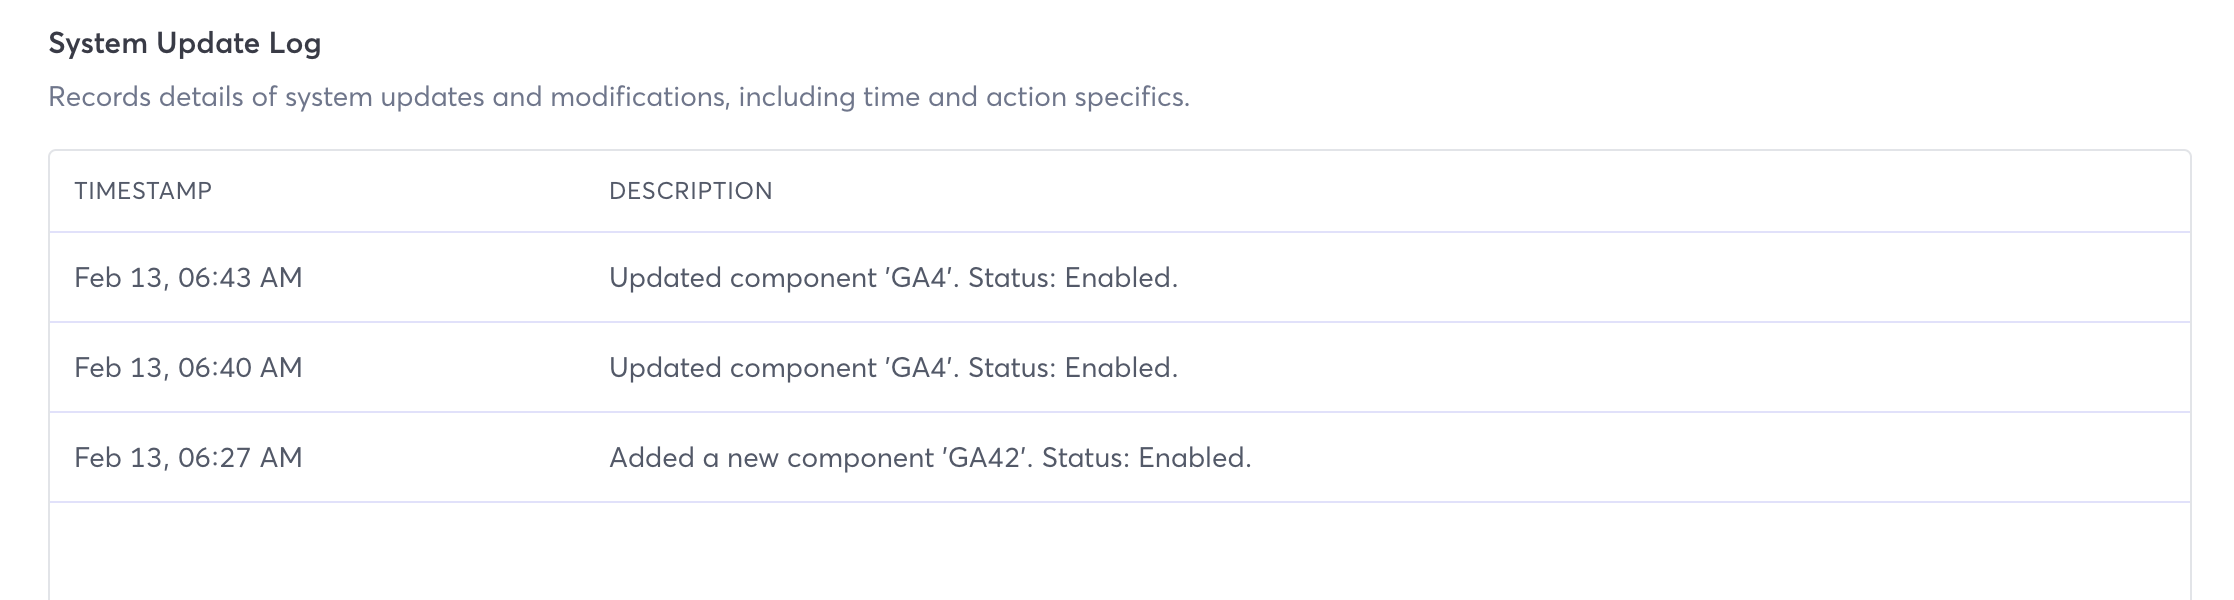
Scroll down to System Update Log.
This section displays the timestamp and description of changes to the EST components and settings made during the selected time period.
Use our interactive API Reference with code generation in 18 programming languages to view change history.
Error Metrics
- Web Console
- REST API
Log in to your Edge Side Tagging dashboard.
Click Components.
Scroll down to Activity Summary and select a time period for which you want to view events:
- Current Hour - The current hour, starting from
X:00. For example, if the current time is 4:23, then metrics and logs for the last 23 minutes are displayed. - Last 24 Hours - The previous full 24 hours. For example, if it is currently Thursday, then metrics and logs from Wednesday are displayed.
- Last 30 Days - The previous full 30 days. For example, if it is currently June, then metrics and logs from Wednesday are displayed.
- Current Hour - The current hour, starting from
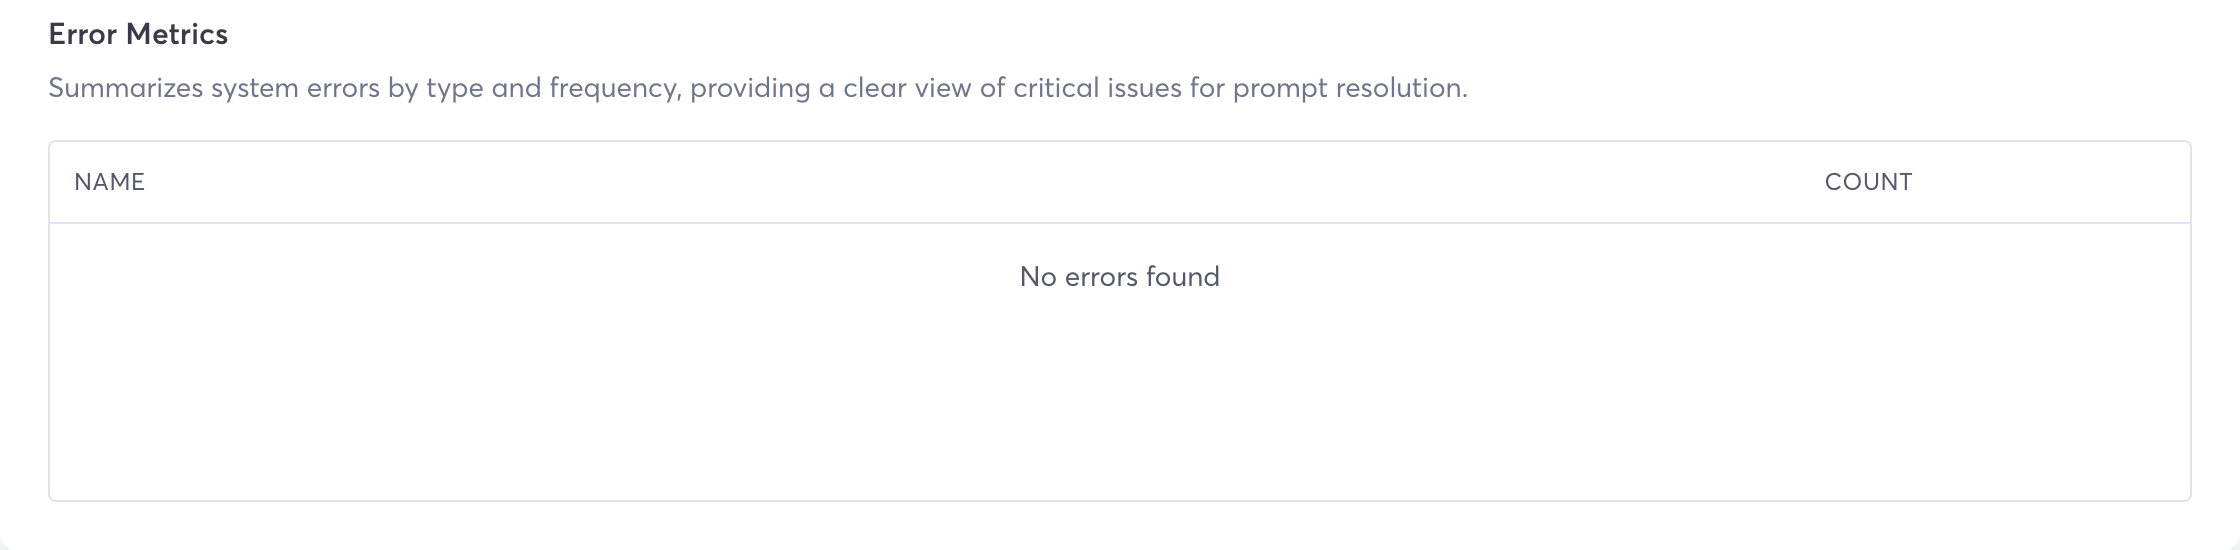
Scroll down to Error Metrics.
This section displays the name and number of errors detected during the selected time period.
Use our interactive API Reference with code generation in 18 programming languages to: